
Curving test grades is a common practice instructors use to adjust a set of scores so the class distribution better reflects intended learning outcomes. Done well, a curve can correct an unexpectedly hard exam or align scores to a syllabus standard. Done poorly, it can feel arbitrary or unfair.
This guide explains how to curve test grades using practical methods (mean, median, linear scaling, z-score), gives worked examples, highlights pros and cons, and offers best practices to keep grading fair and transparent.
Why Instructors Curve Grades
- The exam was more difficult than intended.
- A technical issue (bad item, miskeyed question) affected many students.
- The instructor wants the class distribution to map to learning objectives (e.g., C = minimum competency).
- To compensate for known inequities or test-administration problems.
Curving should be used sparingly and transparently — tell students how and why you’re adjusting grades.
Common Curving Methods (Step-by-Step)
1) Mean (Additive) Curve — add the same points to everyone
When to use: A test was uniformly harder than expected and you want to shift everyone up equally.
Steps:
- Compute class mean (average) raw score.
- Decide target mean (example: raise class average from 68 → 75).
- Calculate add-on = target mean − current mean.
- Add that number of points to every student’s raw score (cap at 100).
Example:
Current mean = 68. Target mean = 75 → add-on = 7 points. Student with 62 → becomes 69.
Pros: Simple, transparent.
Cons: Can push some students over 100; benefits low and high scorers equally (doesn’t change spread).
2) Median (Robust) Curve — shift to median instead of mean
When to use: Scores are skewed (outliers) and you want a more robust central adjustment.
Steps:
- Find class median.
- Choose target median.
- Add the difference to all scores.
Pros: Less affected by extreme outliers.
Cons: Same uniform addition limitations as mean curve.
3) Linear Scaling (Proportional) — multiply scores to stretch range
When to use: You want to preserve relative differences but expand the scale to reach a target maximum or mean.
Steps:
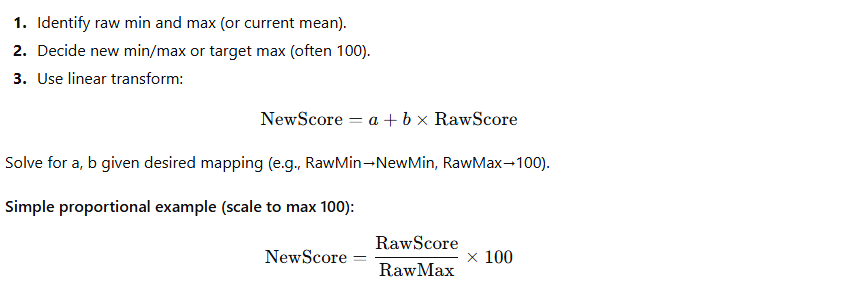
Example: RawMax = 92. Student with 80 → New = (80/92)×100 ≈ 86.96.
Pros: Keeps rank order and relative gaps; expands range.
Cons: Can exaggerate small differences at the top or amplify noise.
4) Z-Score (Standardization) Curve — shift by mean and SD
When to use: You want to standardize scores (useful for combining multiple sections or years).
Steps:
Example: Raw mean μ=68, σ=12; target μ′=75, σ′=10. Raw=80 → z=(80−68)/12≈1.00 → New=75+1×10=85.
Pros: Controls both center and spread; good for comparisons.
Cons: More complex; students may not intuitively understand changes.
5) Rank-based Curve (Bell Curve / Percentile)
When to use: You want a fixed distribution (e.g., set percentages of A/B/C). Use cautiously.
Method: Sort scores, assign letter grades by percentile cutoffs (top 10% = A, next 20% = B, etc.).
Pros: Guarantees distribution.
Cons: Can be unfair when absolute mastery matters; pits students against each other.

Worked Example: Compare Methods
Raw scores: [55, 62, 68, 70, 79, 82, 88, 92]
- Mean ≈ 73.25, Median = 74.5, RawMax = 92, RawMin = 55, SD ≈ 12.3.
- Mean add: target mean 80 → add 6.75 → new 55→61.75 … 92→98.75
- Scale to 100: new = Raw/92×100 → 55→59.78 … 92→100
- Z→(75,10): z for 88≈(88−73.25)/12.3≈1.20 → New≈75+1.20×10=87
Each method produces different outcomes — choose according to fairness goals.
Best Practices & Ethical Considerations
- Be transparent: Publish the curve method in the syllabus or explain it when applied.
- Use curves sparingly: Curving should correct problems, not compensate for poor assessment design.
- Favor learning, not ranking: Prefer methods that reflect mastery rather than forcing distribution.
- Protect high performers: Avoid curves that unfairly penalize students who did well.
- Check item quality: If many missed the same questions, consider removing or rescoring problematic items before curving.
- Document changes: Keep a record of raw and curved scores for appeals and transcripts.
When Not to Curve
- If the exam matches intended difficulty and aligns with learning objectives.
- When absolute competence thresholds are required (licensure, remediation).
- When curve promotes unhealthy competition or penalizes collaboration.
Tools & Shortcuts
Use a spreadsheet or gradebook software to:
- Compute mean/median/SD quickly.
- Apply formulas to entire columns.
- Preserve original scores in a separate column for transparency
For quick checks and projections, try an online grade tool like TestGradesCalculator.com to model the effects of different curving methods before applying changes.
FAQ (People Also Ask)
Q: Will curving always raise my grade?
A: Not necessarily. Some curving methods (like rank-based) can lower some students while raising others. Mean/median add methods raise everyone by the same amount.
Q: Is curving fair to all students?
A: Fairness depends on the method and context. Transparency and appropriate justification improve perceived fairness.
Q: Can I remove a bad question instead of curving?
A: Yes — rescoring or removing flawed items is often preferable and should be done before applying any curve.
Q: Do colleges see curved grades?
A: Colleges receive final grades; they may not know how you curved them unless your institution documents it. Consistent, transparent policies are best.
Conclusion & Next Steps
Curving test grades can be a powerful fix when an assessment does not perform as expected — but it requires thoughtful choice of method, transparency with students, and attention to fairness. Before curving, review item performance, document your reasoning, and model several methods to see their impacts.If you want to experiment with different curving options, use a grade tool to simulate results and keep raw scores intact. Try the Final Grade & Curve Calculator to preview how additive, proportional, or z-score adjustments would change your class distribution.