
Whether you’re a student checking your score, a teacher setting up a grading policy, or a parent trying to understand your child’s report card, a grading chart is the single most important reference in academic life. Yet most people never fully understand how grading scales work, how they connect to GPA, or how different systems compare globally.
This guide covers everything — from the basic percentage scale to weighted GPA, standards-based grading, international systems, and the most common mistakes students make when reading their grades. By the end, you’ll know exactly how to interpret any grade and what steps to take to improve your academic standing.
What Is a Grading Chart?
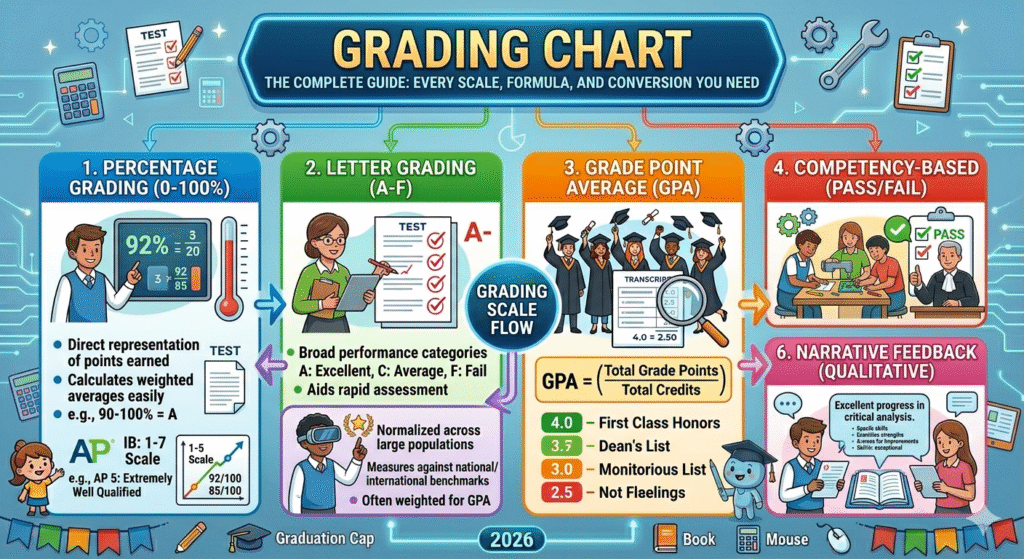
A grading chart (also called a grading scale or grade scale) is a structured system that converts a raw score — a percentage, point total, or rubric rating — into a standardized grade. Schools use grading charts to create consistent, fair assessments across different teachers, subjects, and student groups.
A typical grading chart maps three elements together:
- Percentage range (e.g., 90–100%)
- Letter grade (e.g., A)
- GPA points (e.g., 4.0)
Without a grading chart, a “75” on one teacher’s test might mean something completely different from a “75” on another’s. Grading charts solve this problem by anchoring scores to a shared standard.
Why Do Schools Use Grading Scales?
Grading scales exist for four core reasons:
1. Consistency — Every student in the same course is evaluated against identical benchmarks, reducing subjectivity.
2. Communication — A letter grade or percentage communicates academic performance instantly to parents, colleges, and employers.
3. Decision-Making — Colleges, scholarship committees, and graduate programs use grades (and the GPA derived from them) to make admissions decisions.
4. Motivation — Clear grade thresholds give students specific, measurable targets to aim for.
Understanding how grading scales are structured is the first step toward calculating your grade percentage accurately and knowing exactly where you stand.
The Standard U.S. Percentage Grading Scale
The percentage grading scale is the foundation of most American academic institutions. Each letter grade corresponds to a range of percentage scores earned on tests, assignments, and exams.
Standard Percentage-to-Letter Grade Chart
| Percentage Range | Letter Grade | Standard GPA | Performance Level |
| 97–100% | A+ | 4.0 | Exceptional |
| 93–96% | A | 4.0 | Excellent |
| 90–92% | A− | 3.7 | Very Strong |
| 87–89% | B+ | 3.3 | Above Average |
| 83–86% | B | 3.0 | Good |
| 80–82% | B− | 2.7 | Slightly Above Average |
| 77–79% | C+ | 2.3 | Average |
| 73–76% | C | 2.0 | Satisfactory |
| 70–72% | C− | 1.7 | Marginally Satisfactory |
| 67–69% | D+ | 1.3 | Below Average |
| 63–66% | D | 1.0 | Poor |
| 60–62% | D− | 0.7 | Very Poor |
| Below 60% | F | 0.0 | Failing |
Quick Reference: Wondering what grade a 75% earns? On most U.S. scales, that’s a C or C+. A 70% typically lands as a C−, while an 80% is a solid B−.
One nuance worth knowing: the boundary scores can be tricky. For example, whether 89.5% rounds up to an A or stays a B depends on your institution’s rounding policy — always check before assuming.
Similarly, there’s a common debate about whether a 70% is a C or a D. On most standard scales, 70% is the bottom edge of a C, but some schools set the C floor at 73%. Always verify your school’s specific scale.
How to Calculate a Grade Using the Percentage Formula
Knowing the grading chart is only half the job. You also need to know how to calculate where your score actually lands.
Basic Grade Percentage Formula
Grade Percentage = (Points Earned ÷ Total Points Possible) × 100
Example: You scored 42 out of 50 on a test.
(42 ÷ 50) × 100 = 84% → B
For a more in-depth walkthrough, see how to calculate a grade after a test and how to calculate grades in class throughout the semester.
Calculating a Weighted Grade
When different assignments carry different weights (tests worth 40%, homework worth 20%, etc.), use the weighted average formula:
Final Grade = Σ (Assignment Score × Weight) ÷ Σ Weights
Example:
- Homework: 88% × 20% = 17.6
- Midterm: 79% × 30% = 23.7
- Final Exam: 91% × 50% = 45.5
- Total: 86.8% → B
This is why understanding what weight a test grade carries matters so much for your final standing. A poor performance on a heavily weighted exam can significantly pull down your overall grade, but so can a single C in an otherwise strong semester.
Letter Grading Scale: What Each Grade Really Means
The letter grade system is more than just alphabet soup. Each grade carries a specific academic meaning and communicates your mastery level to colleges and employers.
Letter Grade Meanings
| Letter Grade | Meaning | Typical Admission Implication |
| A+ / A | Mastery / Excellent | Highly competitive for selective colleges |
| A− | Near-mastery | Still very strong academically |
| B+ / B | Good Proficiency | Competitive for most colleges |
| B− | Adequate Proficiency | Acceptable at many institutions |
| C+ / C | Satisfactory / Average | May limit options for selective programs |
| C− | Marginally Passing | Below expectations at many schools |
| D | Minimal / Barely Passing | Credit may not transfer; often must retake |
| F | Failing | No credit awarded; significant GPA damage |
An important distinction many students overlook: whether a C is better than a C− matters not just for self-assessment but for GPA calculations. A C earns 2.0 GPA points; a C− earns only 1.7.
Also, don’t confuse grading scales. A 78% is a C+ on most scales, not a B — a distinction that matters when you’re close to a scholarship threshold or academic probation cutoff.
GPA Grading Scale: How Letter Grades Convert to Points
Your Grade Point Average (GPA) is a numerical summary of your academic performance, calculated by converting letter grades into grade points and averaging them across all courses.
Standard 4.0 GPA Conversion Chart
| Letter Grade | GPA Points | Percentage Equivalent |
| A+ | 4.0 | 97–100% |
| A | 4.0 | 93–96% |
| A− | 3.7 | 90–92% |
| B+ | 3.3 | 87–89% |
| B | 3.0 | 83–86% |
| B− | 2.7 | 80–82% |
| C+ | 2.3 | 77–79% |
| C | 2.0 | 73–76% |
| C− | 1.7 | 70–72% |
| D+ | 1.3 | 67–69% |
| D | 1.0 | 63–66% |
| D− | 0.7 | 60–62% |
| F | 0.0 | Below 60% |
GPA Calculation Formula
GPA = Σ (Grade Points × Credit Hours) ÷ Total Credit Hours
Example:
| Course | Grade | GPA Points | Credit Hours | Quality Points |
| English | A | 4.0 | 3 | 12.0 |
| Math | B+ | 3.3 | 4 | 13.2 |
| History | C | 2.0 | 3 | 6.0 |
| Total | 10 | 31.2 |
GPA = 31.2 ÷ 10 = 3.12
For a step-by-step approach to calculating GPA from letter grades, especially when dealing with mixed course loads, use a dedicated calculator to avoid arithmetic errors.
Common questions students ask: Is 70% equivalent to a 3.0 GPA? No — a 70% typically earns a C− (1.7 GPA points). A 3.0 GPA corresponds to a B (83–86%). And is a 4.0 GPA truly straight A’s? On an unweighted scale, yes. On a weighted scale, it’s more complicated.
Weighted GPA vs. Unweighted GPA
This is one of the most misunderstood areas of academic grading — and it matters enormously for college admissions.
Unweighted GPA
An unweighted GPA treats all courses equally, regardless of difficulty. An A in a regular class and an A in an AP class both earn 4.0 points. The scale maxes out at 4.0.
Weighted GPA
A weighted GPA gives bonus points for more challenging courses:
| Course Level | Grade | Unweighted GPA | Weighted GPA |
| Regular | A | 4.0 | 4.0 |
| Honors | A | 4.0 | 4.5 |
| AP / IB | A | 4.0 | 5.0 |
| Regular | B | 3.0 | 3.0 |
| Honors | B | 3.0 | 3.5 |
| AP / IB | B | 3.0 | 4.0 |
This is why a student can have a weighted GPA above 4.0 — and why understanding how to calculate GPA with weighted courses requires a different formula than standard GPA.
AP courses are graded separately within the College Board’s 1–5 scale, but your school still converts your course grade to a letter grade for your transcript. To understand how AP tests are graded and how that affects your overall GPA, it helps to know both systems.
Key takeaway for college applicants: Many colleges recalculate GPAs on their own unweighted scale for fair comparison. A 3.5 GPA is generally considered good for college at most four-year institutions, while highly selective schools typically expect a 3.9 or higher on an unweighted scale.
Standards-Based Grading (SBG)
Traditional letter grades give you one number for an entire class. Standards-based grading (SBG) takes a different approach — it grades students on each individual learning standard or skill separately.
Typical SBG Scale
| Score | Meaning |
| 4 | Exceeds standard — student extends learning independently |
| 3 | Meets standard — student demonstrates proficiency |
| 2 | Approaching standard — partial understanding |
| 1 | Beginning — limited understanding; significant support needed |
| 0 | No evidence of learning / Not attempted |
SBG is most common in K–8 education and is increasingly used in high school reform efforts. The advantage is granularity: a student might score a 4 in reading comprehension but a 2 in written expression, giving teachers and parents much more actionable information than a single letter grade.
The challenge is that SBG scores don’t convert neatly to GPA, which can complicate high school transcripts and college applications. Schools using SBG typically issue a separate traditional grade for transcript purposes.
Pass/Fail Grading
Some courses — particularly electives, physical education, seminars, and graduate-level research — use a simple Pass/Fail (P/F) or Satisfactory/Unsatisfactory (S/U) system.
How Pass/Fail Works
| Mark | Meaning | Typical Threshold | GPA Impact |
| P | Pass | Usually 60–70% | Not counted |
| F | Fail | Below threshold | Counts as 0.0 |
The major advantage of P/F grading is that it reduces grade anxiety and encourages students to take challenging or unfamiliar courses without risking their GPA. Many universities allow students to convert a limited number of elective courses to P/F grading each semester.
One critical caveat: many graduate programs and scholarship applications require letter grades for major coursework. Taking core classes on a P/F basis can actually hurt your application by limiting the evidence of your academic capability.
International Grading Systems
Academic grading varies dramatically by country. If you’re studying abroad, applying to foreign universities, or working with international transcripts, understanding these differences is essential.
International Grading Scale Comparison
| Country / System | Scale | Top Grade | Pass Mark | U.S. Equivalent |
| United States | A–F / 0–4.0 GPA | A / 4.0 | D (60%) | — |
| United Kingdom | First, 2:1, 2:2, Third | First Class | Third Class | A / B |
| Germany | 1–6 | 1 (Sehr Gut) | 4 (Genügend) | A / D |
| France | 0–20 | 20/20 | 10/20 | A / D |
| India | Percentage / CGPA | Distinction | 40–50% | A / D |
| Australia | HD, D, C, P, F | HD (85%+) | Pass (50%) | A / C |
| Canada | A–F / % based | A+ (90%+) | D (50–55%) | Similar to U.S. |
| Japan | 0–100 / GPA 0–4 | S or A | 60% | A / D |
| International Baccalaureate | 1–7 | 7 | 4 | A / C |
| European Credit (ECTS) | A–F | A | E | A / D |
Converting International Grades to U.S. GPA
Most U.S. graduate schools use either World Education Services (WES) or the American Association of Collegiate Registrars (AACRAO) to evaluate foreign transcripts. The general conversion for common systems:
| German Grade | French Grade | UK Class | U.S. GPA Equivalent |
| 1.0–1.5 | 16–20 | First | 4.0 |
| 1.6–2.5 | 14–15 | 2:1 (Upper) | 3.3–3.7 |
| 2.6–3.5 | 12–13 | 2:2 (Lower) | 2.7–3.0 |
| 3.6–4.0 | 10–11 | Third | 2.0–2.3 |
How Grading Scales Affect GPA and Academic Performance
Every grade you earn has compounding effects on your GPA — and the impact of any single grade depends heavily on how many credit hours the course carries.
The Credit Hour Effect
A 3-credit course has a proportional impact on your GPA. A 4-credit course (like many STEM classes) carries even more weight. This means a low grade in a high-credit course is particularly damaging — and a recovery in a high-credit course is particularly rewarding.
To find out what grade you need to achieve a specific final average, or to understand how much a test grade is worth within your overall course grade, use a weighted grade calculator rather than guessing.
GPA Impact by Scenario
| Current GPA | Credits Completed | New Course Grade | New GPA |
| 3.5 | 30 | A (4.0) × 3 cr | 3.52 |
| 3.5 | 30 | C (2.0) × 3 cr | 3.42 |
| 3.5 | 30 | F (0.0) × 3 cr | 3.29 |
| 2.5 | 30 | A (4.0) × 3 cr | 2.56 |
| 2.5 | 30 | A (4.0) × 12 cr | 2.86 |
This table makes something clear: raising a GPA quickly is genuinely difficult when you have many credits under your belt, because each new grade is weighted against your entire history. Taking more credit hours of strong performance is the fastest recovery path.
Common Grade Conversion Methods
Converting Points to Percentage
When an assignment is out of an unusual total (like 9 out of 11), many students aren’t sure what grade that is. The formula is always the same:
Percentage = (Points Scored ÷ Total Points) × 100
For example, 9 out of 11 on a test works out to 81.8% — a solid B−. Similarly, 15 out of 20 equals 75%, which is a C on most standard scales.
Want to understand whether 60% earns an F or D? On most U.S. scales, 60% is the very bottom of D− — barely passing. Below 60% is an F. However, some schools set their D floor at 65%, making 60% an F on their scale.
Grade Curving
When a test produces unexpectedly low scores across the class, teachers sometimes apply a curve to adjust grades upward. Common curving methods include:
- Flat addition: Add a fixed number of points to every score.
- Square root curve: Multiply the square root of each score by 10 (e.g., √84 × 10 = 91.6).
- Scale to highest score: Divide every score by the highest score and multiply by 100.
For a detailed breakdown of how to curve test grades fairly, each method has trade-offs depending on the score distribution.
Calculating Semester and Final Grades
Your semester grade is typically a weighted combination of all your coursework. To calculate your semester grade or final grade, you need to know the weight of each component (quizzes, tests, projects, final exam) and multiply accordingly.
For a complete step-by-step walkthrough, see how to calculate final grades and how to calculate a weighted average grade when coursework carries unequal weights.
How to Grade Assignments: A Teacher’s Perspective
Teachers don’t just pull grades out of thin air — there’s a systematic approach to how assignments are graded that students benefit from understanding.
Most assignments are graded using one of these methods:
Points-based: Total points earned divided by total possible points. Straightforward and transparent.
Rubric-based: Each component of an assignment (argument quality, evidence, mechanics) receives a score based on pre-defined criteria. This method is more nuanced and reduces bias.
Percentage weight: Assignments are scored independently but carry a predetermined weight toward the final grade.
Understanding which method your teacher uses helps you calculate your overall score and prioritize your effort. A rubric-based assignment with five equal components, for instance, means no single mistake can drop you below an 80%.
The 5.0 GPA Scale
Some high schools and magnet programs use a 5.0 GPA scale to accommodate advanced coursework. On this scale, an A in an AP or IB course earns 5.0 quality points rather than 4.0.
A 5.0 GPA in the U.S. signals that a student is earning top marks in the most rigorous courses available. It’s important to note that colleges normalize GPAs during review, so a 5.0 on a weighted scale doesn’t automatically beat a 4.0 on an unweighted one.
Common Mistakes Students Make When Interpreting Grades
Even smart students misread their grades. Here are the most frequent errors:
1. Assuming all scales are the same. A 70% might be a C at one school and a D at another. Always check the specific grading policy for each course.
2. Ignoring rounding rules. An 89.4% stays a B+ at many schools, not an A−. Never assume rounding unless your teacher explicitly confirms it.
3. Miscalculating weighted grades. If your final exam is worth 40% of your grade, a single poor performance can drop your overall grade significantly more than students expect.
4. Confusing weighted and unweighted GPA. A 4.3 weighted GPA might convert to a 3.8 unweighted — which is what many colleges actually evaluate.
5. Not tracking cumulative GPA trends. One bad semester doesn’t ruin a GPA permanently, but students who don’t calculate their total grade and grade average regularly are often blindsided by their standing.
6. Overlooking pass/fail implications. A “pass” doesn’t show strength. A strong letter grade in the same course demonstrates competency much more effectively to graduate schools.
Tips for Improving Your Grades
Understanding your grading chart is step one. Acting on that knowledge is step two.
Know exactly where you stand. Use an online grade calculator to find your current overall score at any point in the semester. Don’t wait for a report card to discover you’re behind.
Target high-weight assignments. Not all grades are equal. A test worth 30% of your course grade deserves more preparation time than a homework assignment worth 2%.
Ask for partial credit or grade recovery. Many teachers allow test corrections, resubmissions, or extra credit opportunities. These are especially valuable if you’re on the border between letter grades.
Understand your school’s rounding policy. Some schools round 89.5% to an A−; others don’t. Knowing this can change your study priorities in the final weeks of a semester.
Focus on high-credit courses. Because credit hours amplify the GPA impact of your grade, prioritize courses that carry more weight. Earning an A in a 4-credit STEM class moves your GPA more than an A in a 1-credit elective.
Use grade calculators strategically. Before finals, calculate exactly what score you need on your final exam to earn the grade you want. See how to calculate what grade you need and plan accordingly.
Key Takeaways
- A grading chart maps percentages, letter grades, and GPA points to a consistent standard used across courses and institutions.
- The standard U.S. scale runs from A+ (97–100%, 4.0 GPA) to F (below 60%, 0.0 GPA).
- Weighted GPA gives bonus points for AP, Honors, and IB courses; it can exceed 4.0 and is separate from unweighted GPA.
- Standards-based grading uses a 1–4 scale to assess individual skills, offering more detail than a single letter grade.
- Pass/Fail grading eliminates GPA impact but also eliminates evidence of academic strength.
- International grading systems vary widely — always use an official conversion service (WES, AACRAO) for transcript evaluation.
- The most common student mistake is not knowing their school’s specific grading scale and rounding policy.
- Grade calculators, semester planners, and weighted average tools are the most practical resources for actively managing your GPA.
Frequently Asked Questions (FAQ)
Q1: What is a passing grade in most U.S. schools?
In most American schools, a D (60–69%) is technically a passing grade for credit purposes, but many colleges require a C or higher for a course to count toward a major or to satisfy prerequisites. A D may not transfer to another institution.
Q2: How is GPA calculated when you have both letter grades and percentages?
First, convert percentage scores to letter grades using your school’s grading chart. Then convert each letter grade to GPA points (A = 4.0, B = 3.0, etc.), multiply each by the course’s credit hours, sum the results, and divide by total credit hours.
Q3: Does a plus/minus grading system significantly affect GPA?
Yes. The difference between an A (4.0) and an A− (3.7) might seem small, but across multiple courses, it can shift your cumulative GPA by several tenths of a point — which can matter for honor roll, scholarships, and graduate school admissions.
Q4: What does a 3.5 GPA mean in terms of letter grades?
A 3.5 GPA sits between a B+ and an A−. It typically means a mix of A’s and B+’s, or mostly A−’s across your coursework. Most institutions consider a 3.5 academically strong and competitive for graduate programs and merit scholarships.
Q5: Is an 89.5% an A or a B?
This depends entirely on your school’s rounding policy. Some institutions round 89.5% to 90%, awarding an A−. Others do not round and leave it as a B+. Always check your syllabus or ask your instructor directly.
Q6: How do AP courses affect my GPA on a standard 4.0 scale?
On an unweighted 4.0 scale, AP courses are treated identically to regular courses — an A is still 4.0. On a weighted scale, an A in an AP course typically earns 5.0 points, raising your weighted GPA above the standard maximum.
Q7: What is standards-based grading and how is it different from traditional grading?
Standards-based grading rates students on individual learning objectives using a 1–4 scale, rather than averaging all work into a single letter grade. It provides more detailed feedback about specific strengths and weaknesses, but doesn’t translate directly to a GPA on the 4.0 scale.
Q8: Can I raise my GPA in one semester?
It depends on how many credits you’ve already completed. The more credits you have, the slower GPA movement becomes because each new semester is averaged into a larger history. However, taking a heavier credit load of high-performance courses in one semester can accelerate recovery noticeably.
Q9: How do international students convert their grades to the U.S. GPA scale?
International students applying to U.S. colleges should use a recognized credential evaluation service such as WES (World Education Services) or AACRAO. These organizations convert foreign grading systems to U.S. equivalents using country-specific conversion guidelines.
Q10: What is the difference between a weighted average grade and a simple average grade?
A simple average treats every assignment equally regardless of point value. A weighted average multiplies each assignment score by its contribution to the total grade, then sums those values. Most real-world course grades use weighted averages, so understanding this distinction helps you prioritize where to focus your effort.
Conclusion
A grading chart isn’t just a classroom poster — it’s the framework that connects every test score, homework grade, and final exam to your academic standing, your GPA, and ultimately your opportunities after school. Whether you’re navigating a standard U.S. percentage scale, an international transcript, or a weighted GPA calculation for college applications, understanding how these systems work gives you a concrete advantage.
The most empowered students are the ones who don’t just check their grades — they understand the mechanics behind them. They know exactly what percentage they need on the next assignment, how a single course affects their cumulative GPA, and how to convert any score into the letter grade and GPA value that matters for their goals.
Use the tables, formulas, and calculators in this guide as your ongoing reference — and take the guesswork out of your academic performance.