There is no single national elementary grading scale. Each school or district picks its own. Most use one of three systems: descriptor symbols in the early grades (such as E, S, D, I, N, U), letter grades with percentage ranges in the upper elementary grades (such as A = 93–97%), or standards-based marks (such as 4, 3, 2, 1).
This guide shows the most common elementary grading scales with charts, worked examples and tips for parents and teachers. Always check your own school’s report card key, because cutoffs differ.
Key Takeaways
- Early grades (K–2) often use symbols or words such as Excellent, Satisfactory and Needs Improvement, not percentages.
- Upper elementary (grades 3–6) often switch to letter grades. Some schools use the 10-point scale (A = 90–100%), others use plus/minus ranges (A+ = 98–100%).
- Standards-based report cards use levels (for example 4 = exceeds, 3 = meets) and often have no GPA.
Common Elementary Grading Systems at a Glance
| System | Typical Grades | What You See | Example Marks |
|---|---|---|---|
| Descriptor / symbol scale | K–2 | Letters or words for progress | E, S, D, I, N, U |
| Letter grades with percentages | 3–6 (sometimes 1–2) | A–F with score ranges | A+, A, A–, B+ … F |
| Basic 10-point scale | K–12 | A–F, no plus/minus | A = 90–100% |
| Standards-based (numeric levels) | K–6 | Skill ratings, not averages | 4, 3, 2, 1 |
Elementary Descriptor Scale (Grades K–2)
Many schools avoid letter grades for the youngest students. One example uses six symbols:
| Symbol | Meaning |
|---|---|
| E | Excellent |
| S | Satisfactory |
| D | Developing |
| I | Improving |
| N | Needs Improvement |
| U | Unsatisfactory |
Schools often keep this same scale for behavior and study skills marks even after students move to letter grades in grades 3–6. Other schools use shorter versions, such as O (outstanding), S (satisfactory) and N (needs improvement). Symbols show progress, not a percentage, so there is nothing to calculate.
Elementary Letter Grade Scale (Grades 3–6)
Upper elementary grades often use letter grades with plus and minus. One school’s published scale looks like this:
| Percentage | Letter Grade | Meaning |
|---|---|---|
| 98 – 100% | A+ | Outstanding |
| 93 – 97% | A | Excellent |
| 90 – 92% | A– | Excellent |
| 88 – 89% | B+ | Very Good |
| 83 – 87% | B | Good |
| 80 – 82% | B– | Above Average |
| 78 – 79% | C+ | Above Average |
| 73 – 77% | C | Average |
| 70 – 72% | C– | Below Average |
| 68 – 69% | D+ | Poor |
| 62 – 67% | D | Barely Passing |
| 60 – 61% | D– | Barely Passing |
| 59% and below | F | Failing |
Notice that this scale puts the A+ at 98%, not 97% as many high schools do. Cutoffs for each letter differ by school, so always use the one on your child’s report card. If a published chart lists the same percentage in two rows, ask the school which grade applies.
Basic 10-Point Elementary Grading Scale With Quality Points
Some schools serve both elementary and high school grades and use one simple scale with no plus or minus:
| Letter Grade | Numerical Average | Quality Points | Grade Point Average Range |
|---|---|---|---|
| A | 90 – 100% | 4 | 4.0 – 3.5 |
| B | 80 – 89% | 3 | 3.4 – 3.0 |
| C | 70 – 79% | 2 | 2.9 – 2.0 |
| D | 60 – 69% | 1 | 1.9 – 1.0 |
| F | 59% and below | 0 | 0.0 |
| I | Incomplete work | 0 | — |
| NG | No grade | 0 | — |
Some schools also require teachers to keep every graded test on file until the start of the next school year, so families can ask to review them. Learn how this scale works in more depth in different grading scales for results calculation, the grade scale guide and the grading chart.
Standards-Based Grading in Elementary School
Standards-based report cards rate each skill (like “adds within 20” or “reads grade-level text”) instead of averaging all work. A common four-level scale is:
| Level | Typical Label | Meaning |
|---|---|---|
| 4 | Exceeds | Goes beyond the grade-level standard |
| 3 | Meets | Shows the skill consistently |
| 2 | Approaching | Shows the skill with support |
| 1 | Beginning | Not yet showing the skill |
A “3” means the student is on track, not average. It is not the same as a C. Read more in what is a 2.5 in standards-based grading.
How to Convert Elementary Scores (Step by Step)
Formula:
(Points Earned ÷ Total Points) × 100 = Percentage → match it to your school’s scale
Example 1: A 20-Point Quiz
A student scores 17 out of 20.
- Step 1: 17 ÷ 20 = 0.85
- Step 2: 0.85 × 100 = 85%
- Step 3: Match the chart → B (83–87% on the plus/minus scale above, and 80–89% on the basic scale)
See how to calculate grade percentage for the full method, or use the easy grade calculator.
Example 2: Weighted Report Card Grade
Say a student in grade 5 has:
- Homework (25% of grade): 92%
- Classwork (25% of grade): 85%
- Tests (50% of grade): 80%
Weighted Grade = (Score₁ × Weight₁) + (Score₂ × Weight₂) + (Score₃ × Weight₃)
Weighted Grade = (92 × 0.25) + (85 × 0.25) + (80 × 0.50) = 23.0 + 21.25 + 40.0 = 84.25%
On the plus/minus scale above, that is a B (83–87%). See how to calculate weighted average grades for more.
Example 3: Averaging Standards-Based Marks
A student earns these marks for one skill over four checks: 3, 4, 3, 2.
- Step 1: Add the marks → 3 + 4 + 3 + 2 = 12
- Step 2: Divide by the number of marks → 12 ÷ 4 = 3.0
- Step 3: Read the level → Meets
Many standards-based schools use the most recent evidence instead of an average, so ask how your school decides.
Quick Conversion Table: Scores on a 20-Point Quiz
Using the plus/minus scale above:
| Score | Percentage | Letter Grade |
|---|---|---|
| 20/20 | 100% | A+ |
| 19/20 | 95% | A |
| 18/20 | 90% | A– |
| 17/20 | 85% | B |
| 16/20 | 80% | B– |
| 15/20 | 75% | C |
| 14/20 | 70% | C– |
| 13/20 | 65% | D |
| 12/20 | 60% | D– |
| 11/20 | 55% | F |
Compare a related score on the 15/20 grade page, and see what grade is 80 for a common boundary.
Do Elementary Students Have a GPA?
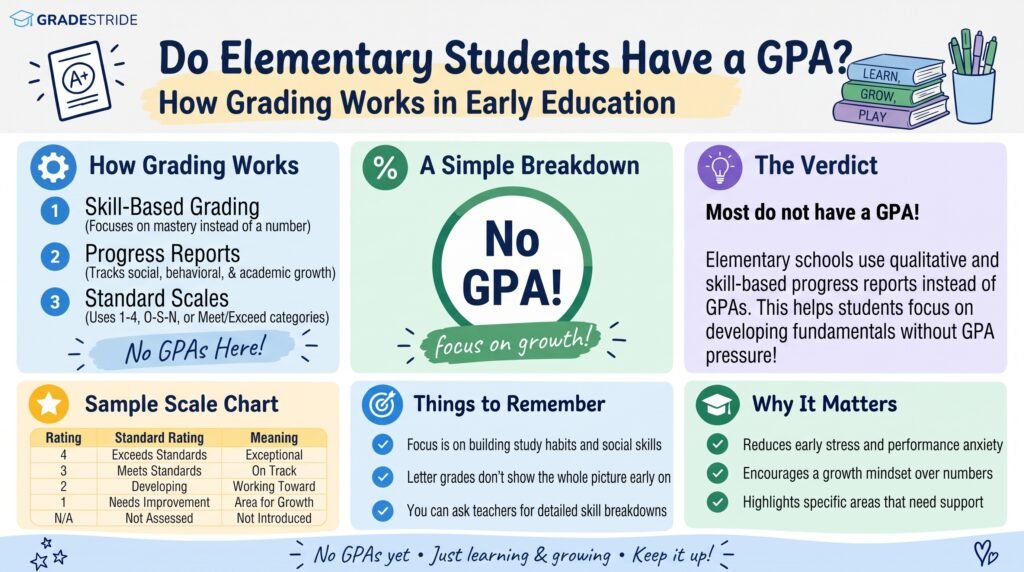
Usually not. Most elementary schools do not calculate a GPA. A few schools that also serve higher grades assign a grade point range to each letter, as in the table above. If your school does, you can run the numbers in the GPA calculator.
Tips for Parents
- Find the report card key first. It explains every symbol, letter and number.
- Read the comments. Teacher notes often say more than the mark.
- Ask what “meets” or “satisfactory” means. It usually means on track.
- Look for patterns, not one grade. One low quiz rarely defines a term. See how much is a test grade worth.
- Praise effort. Young students respond best to encouragement and clear next steps.
Tips for Teachers
- Publish your scale at the start of the year, with the exact cutoffs and rounding rule.
- Use the same scale across subjects when possible.
- Explain symbols in plain language on the report card.
- Grade for the skill, not the speed. See how to grade assignments.
- Track grades in one place. The guide on how to calculate grades in class shows a simple method.
Mistakes to Avoid
- Assuming one scale fits every school. Cutoffs vary.
- Treating a standards-based “3” as a C. It means on track.
- Reading symbols as percentages. E, S and N do not map to a fixed score.
- Ignoring behavior marks. They often use a separate scale.
Frequently Asked Questions (FAQ)
1. What is the elementary grading scale?
There is no single scale. Schools commonly use symbols (E, S, D, I, N, U) in early grades, letter grades such as A = 93–97% in upper elementary, or standards-based levels such as 4, 3, 2, 1.
2. What does E, S, D, I, N, U mean on an elementary report card?
They stand for Excellent, Satisfactory, Developing, Improving, Needs Improvement and Unsatisfactory. Many schools use them in kindergarten through grade 2.
3. When do elementary schools start giving letter grades?
It varies. Many start in grade 3, while others start in grade 1 or 2. Some never use letter grades and rely on standards-based marks.
4. What percentage is an A in elementary school?
On a basic 10-point scale, an A is 90–100%. On a plus/minus scale, an A can be 93–97%, an A– 90–92%, and an A+ 98–100%.
5. What percentage is a B in elementary school?
On a basic scale, a B is 80–89%. On the plus/minus scale shown here, a B is 83–87%.
6. What is a failing grade in elementary school?
Usually 59% and below, or an F. Some schools use “Needs Improvement” or “1” instead of F in the early grades.
7. What does a 3 mean on a standards-based report card?
A 3 usually means “meets the standard”: the student is on track for their grade level. It is not an average mark.
8. Do elementary schools use GPA?
Most do not. A few schools that serve both elementary and high school grades assign a GPA range to each letter.
9. Is the elementary grading scale the same as the high school scale?
Not always. Some schools use the same 10-point scale across all grades. Others use symbols or standards-based marks in elementary and switch to percentages later.
10. Where can I find my child’s grading scale?
Check the report card key, the school handbook or the district website. If it is not listed, ask the teacher for the exact cutoffs.
Conclusion
The elementary grading scale depends on the school: symbols in the early grades, letter grades with percentage cutoffs in upper elementary, or standards-based levels that track skills. Once you know which one your child’s school uses, a report card is easy to read, and you can convert any score with a simple percentage calculation.
Check any score with the easy grade calculator, and keep the full picture in mind with how to calculate grades in class.